
9 Early Metrics That Predict PLG Success (and How to Track Them)
Ben Williams from PLGeek and I share a deep dive perspective on key metrics to track and why for driving Product-Led Growth. (#96)


I connected with Ben Williams a couple years ago, shortly after starting Focused Chaos. I loved his content at PLGeek—the depth, examples and thinking—and always wanted to find a way to collaborate. Recently I reached out to suggest we write a post together on PLG’s key metrics. This article is the result of our work--I hope you enjoy it!
Growth without insight is just luck. The earlier you measure the right things, the better you can build, iterate, and scale.
Whether you’re launching a new SaaS product or breathing life into an initial MVP, success in a Product-Led Growth (PLG) model often shows up first as early signals—leading indicators that you’re building something people want. These signals can take many forms, from product usage patterns and engagement to conversion rates. The key is recognizing and interpreting these early signs to guide your next steps.
In this post, we'll dive into 9 metrics that are genuine early predictors of long-term product-led success. We'll show you what to track, how to track it, and why it matters—complete with examples from real companies and tools we've worked with or used.
1. Time-to-Value (TTV)
What it is: The time it takes for a new user to experience the core value of your product for the first time—their "Aha! moment."
Why it matters: A long TTV is a silent killer. When users don't quickly experience your product's value, they form negative first impressions that are nearly impossible to overcome. For example, I tried Make.com awhile ago, found it confusing and too open-ended, ultimately giving up very quickly.
How to track it:
Define your product's "Aha! moments" with precision
Instrument your product to capture timestamps from signup to value realization
Calculate the median time (not average, which can be skewed by outliers)
Example: Canva users reach value as soon as they create their first design. Their frictionless onboarding flow encourages users to do that within minutes. This speed-to-value is core to their PLG success.
Insight: As Ben W. wrote in "Are You Making This Onboarding Mistake?", for complex B2B products, obsessing over the shortest possible TTV can actually backfire. What he calls "Rush-To-Value" can lead to superficial understanding and poor retention. The goal shouldn't be the fastest possible time to value, but the right tempo that ensures comprehension and habit formation.
Further Reading: I did a comprehensive survey of product leaders and founders on how they think about TTV:

2. Activation Rate
What it is: The percentage of new users who successfully perform a predefined key action or set of actions that signifies they're on the path to build a consistent habit around using the product.
Why it matters: Activation is a cornerstone early metric in PLG. It directly measures your product's ability to deliver on its initial promise and demonstrate value quickly. Users who fail to activate are highly unlikely to become engaged, long-term users or paying customers.
How to track it:
Define what activation means for your product across the constituent steps of setup, aha, and habit moments
Measure the percentage of signups that complete those steps within your defined window
For B2B, measure at the account/team level, not just individual users
Example: At Snyk, activation was defined as F30D, meaning the account Fixed at least one detected vulnerability in the first 30 Days. This definition was chosen because it strongly correlated with mid-term retention and monetization.
Example: At Keyhole, a social media analytics company, they redid the initial onboarding experience by presenting a dashboard with demo data. This gave users instant clarity on how to use Keyhole and the value they’d get, increasing Activation Rate to 45% for the majority of their self-serve users.
Insight: As Ben W. explained in "Stop Making This Activation Mistake", B2B activation is fundamentally different from B2C. In B2B, you need to think about distributed activation patterns where different team members play different roles in the activation journey.
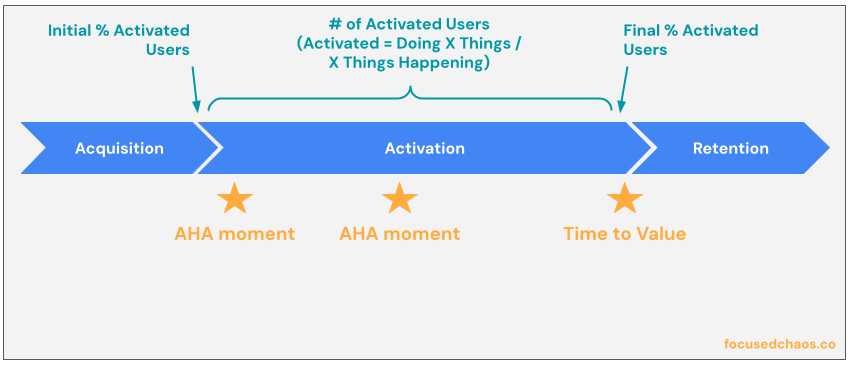
Insight: Activation and TTV aren’t necessarily the same thing. You may have multiple “Aha! moments” which collectively lead a user to getting “hooked” into the product. Here’s a simplified visual to illustrate this:
3. Key Feature Adoption Rate
What it is: The percentage of users who actively engage with specific, critical product features that are essential for experiencing your core value proposition.
Why it matters: While overall Activation Rate provides a summary, the adoption rate of key features offers a more granular and diagnostic view of the early user journey up to and beyond activation milestones. It helps pinpoint specific bottlenecks in your activation flow and ongoing UX.
How to track it:
Identify the features most critical to activation and engagement
Track the percentage of new users/teams who use each feature
Analyze adoption patterns to identify where users get stuck
Evaluate your best users and what makes them different from others; optimize for that
Example: ClickUp tracks adoption of features like “Time Tracking” and promotes underutilized ones via onboarding nudges and tooltips.
Insight: The real value of tracking key feature adoption lies in its diagnostic capability. If your overall Activation Rate is low, analyzing the adoption rates of specific features in your activation flow can pinpoint the exact point of failure, enabling targeted improvements.

4. Product Stickiness
What it is: A metric that measures how frequently users return to your product, calculated as the ratio of Daily Active Users (DAU) to Monthly Active Users (MAU), or as Weekly Active Users (WAU)/MAU, depending on the natural frequency of the problem you solve - expressed as a percentage.
Why it matters: A high stickiness ratio indicates your product has become integrated into users' regular routines or workflows. It signifies that users find consistent value and have developed habitual usage patterns, which is a powerful predictor of long-term retention.
How to track it:
Define what constitutes a "meaningful action" for active user status
Calculate DAU/MAU ratio (or WAU/MAU for products with weekly cadence)
Segment by user type and acquisition cohort
Example: VarageSale, a consumer marketplace where I was VP Product, had a DAU/MAU of ~40%, which means 40% of their monthly active users used VarageSale every single day. That was incredible stickiness, which investors said was similar to WhatsApp.
Insight: The validity of the stickiness ratio as a predictor rests heavily on how "active user" is defined. If activity is measured merely by logins, the DAU/MAU ratio can be misleadingly high. Define "active" based on core value-driving actions to ensure this metric reflects genuine, valuable engagement.
In B2B when nurturing accounts, looking at this data normalized on a per licensed user basis can reveal important account penetration signals.
Insight: Stickiness is so important we defined it as one of the key steps that startups go through in Lean Analytics. Unfortunately, most startups fail at Stickiness because they simply do not provide enough consistent value (even if they go on to acquire tons of users—the Virality step—or raise tons of capital).

5. Early Retention Rate (Day 1 / Week 1 / Month 1)
What it is: The percentage of new users who return to use your product shortly after their initial engagement—specifically on day 1 or within the first week, and at day 30.
Why it matters: The first few days are critical for users to experience initial value, understand your product, and begin forming habits. High early retention is highly predictive of long-term retention and overall product health.
How to track it:
Group users into cohorts based on their signup date
Track the percentage who return on day 1 post-signup and within the first week
Look for patterns in the retention curve across different cohorts
Example: In "Minute Monday 12: Retention problems", Ben W. showed how retention curves reveal product-market fit. If your retention curve looks like Product B (rapidly declining to zero), you have fundamental issues with your product value proposition.

The sharper the initial day 1 / day 7 / day 30 drops are, the more acute your problem is with demonstrating your early value.
Insight: As Ben W. explained in "Churn - The Silent Killer", poor retention compounds over time. A 15% monthly churn rate means your business will plateau in 24 months regardless of how many new users you acquire. Early retention is your first indicator of long-term retention health.
Further reading: 10 High Impact Ways to Use Cohort Analysis in PLG
6. Website Visitor to Signup Conversion Rate
What it is: The percentage of unique visitors to your website who successfully complete the signup process for a free trial or freemium product.
Why it matters: This rate directly measures the effectiveness of your website, positioning, and associated marketing efforts in translating initial interest into product engagement. It's a critical early predictor of the volume of users entering your product-led funnel.
How to track it:
Track unique website visitors through web analytics
Count completed signups (not just form submissions)
Calculate the conversion percentage and segment by traffic source
Example: OpenView’s last report on this suggests medians of 5% and 9% for PLG companies with freemium and free trial models respectively, with rates below 2% considered problematic and exceptional performers reaching up to 15% (freemium) or 20% (free trial).
Insight: This metric is heavily dependent on factors before a user even interacts with the product itself: website design, message clarity, perceived brand trust, and signup form simplicity. Optimising requires strong collaboration between Marketing and Product teams.
Insight: I think of startups as a system, which you can map to identify the trouble spots you need to focus on. For example, you may test website design, message clarity and value propositions early to get some people through, but you don’t necessarily optimize for visitor to conversion rate initially—you just need some people to get through the front door in order to validate activation, stickiness and early retention.

7. Virality / K-Factor
What it is: A metric that quantifies how your product spreads organically as existing users introduce it to new users, calculated as the average number of additional new users that each existing user generates.
Why it matters: Virality, particularly when the K-Factor is greater than 1, predicts exponential growth and highly efficient customer acquisition. It allows your product to scale rapidly with lower reliance on paid marketing, drastically reducing CAC.
How to track it:
Track the average number of invitations sent per user
Measure the conversion rate of those invitations
Calculate K-Factor as invites per user × conversion rate
Example: Dropbox's famous referral program, offering free storage for both the referrer and the new user, drove their K-Factor above 1 for significant periods, fueling their explosive early growth.
Insight: Virality manifests in different ways: inherent collaboration needs, incentivized referrals, value virality (receiving something useful), or exposure virality (showing off results). Understanding which type(s) are most relevant to your product is key to designing effective viral mechanisms.
Further reading: See Word of Mouth Coefficient for virality on less easily trackable sources.
8. Free/Trial-to-Paid Conversion Rate
What it is: The percentage of users who move from a free trial or freemium plan to a paid subscription within a specified timeframe.
Why it matters: This metric directly validates whether the value experienced in the free tier is compelling enough to motivate users to pay. A healthy conversion rate predicts future revenue streams and indicates the sustainability of your free model.
How to track it:
Calculate the percentage of free users who convert to paid within a specific timeframe
Segment by activation level, user persona, and acquisition source
Compare against industry benchmarks (typically 3-5% for freemium, 15%-30% for trials in B2B)
Example: Navattic saw free-to-paid conversion rates soar after optimizing their onboarding flow and making aha moments more visible. They discovered that users weren’t anchored on their next step. They would spend a lot of time clicking between different pages or features without a clear sense of direction. This often meant they bounced right away. Along with templates and in-app set-up guides, they created a more hand-held onboarding where users entered their product URL, added captures, and were taken immediately to a demo builder to start creating a demo. As a result they were able to 5x their free-to-paid conversion (along with moving activation rates from ~5% to 33%).
Insight: The choice between freemium and free trial fundamentally alters your acquisition funnel. Freemium models typically cast a wider net, attracting more users but with lower conversion rates (around 5%). Free trials attract fewer users but convert at much higher rates (15%-30%). Your choice should align with your product complexity and target market.
Further Reading: Deconstructing & Mapping B2B SaaS Business Models

9. Product-Qualified Accounts (PQAs)
What it is: Accounts that have demonstrated buying intent through product usage (rather than just demographic fit).
Why it matters: PQAs are the lifeblood of product-led sales. They close faster, churn less, and require less convincing than traditional MQLs.
How to track it:
Define behavior thresholds based on usage patterns of your best customers
Create a scoring model that weights different actions based on their correlation with conversion
Integrate with your CRM to enable sales follow-up
Example: At Snyk, Ben W. and his team created a PQA framework that identified accounts showing strong usage signals including activation, engagement states, and that matched their ideal customer profile. This allowed their sales team to focus on high quality opportunities that were already extracting value from the product.
Insight: Don't set your PQA thresholds too high. The goal isn't to wait until teams are desperate to upgrade—it's to reach them when they're beginning to see value but before they hit painful limitations.
Important: Account-Level Metrics in B2B
Account-level metrics are the metrics that show how active and engaged accounts are as a whole, not just individual users, by aggregating behavior across all users within an account.
As Ben W. explained in "The importance of account level analytics in B2B", in B2B, every user action happens in the context of a team, workspace, company, or account. Without account-level metrics, you're flying blind.
Consider this hypothetical example with Loom:
1M users split across 10,000 paying companies
80% of users are active (800,000 Weekly Creating Users)
Is this good? You can't know without the account perspective:
Scenario A: 9,000 Weekly Creating Teams (90% of accounts active) = Healthy
Scenario B: 1,000 Weekly Creating Teams (10% of accounts active) = Problematic
Insight: Most analytics platforms don't provide account-level analytics out of the box. You'll need to implement proper group/account tracking and potentially use specialized tools or add-ons like Amplitude's Accounts feature.
Data Quality: The Foundation of Trustworthy Metrics
One thing that's often overlooked: none of these metrics matter if your data isn't trustworthy.
As Ben W. explained in "The Importance of Trustworthy Data", without reliable data, you risk making decisions that waste resources and miss growth opportunities.
Before you dive deep into metrics, ensure you have:
A clear instrumentation style guide
Collaborative schema design with stakeholders across the business
A single source of truth for tracking data
Schema validation in your CI pipeline
In B2B PLG especially, ensuring proper account/group tracking is essential. Without it, your metrics will be incomplete at best and misleading at worst.
The 3 Most Critical Metrics for Predicting PLG Success

If we had to pick just three metrics that are most predictive of PLG success, they include:
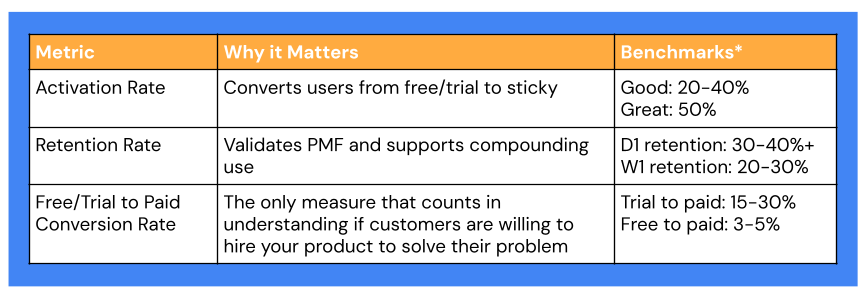
1. Activation Rate
Why: Activation is the foundation of everything else. If users don't activate, they won't retain, convert, or expand.
Benchmark: 20-40% activation is good. Over 50% is excellent depending on the complexity of onboarding.
2. Early Retention Rate (D1/W1)
Why: Early retention is a powerful leading indicator of product-market fit and long-term retention. It tells you if users are finding immediate value in your product.
Benchmark:
D1 retention above 30-40% is good
W1 retention above 20-30% is good
3. Free/Trial-to-Paid Conversion Rate
Why: This is the ultimate validation that your product delivers enough value that people are willing to pay for it. It's the bridge between product usage and business success.
Benchmark:
B2B SaaS trials: 15-30%
B2B SaaS freemium: 3-5%
Higher for product-qualified accounts
TL;DR – What to Focus On for PLG Success
If you’re executing PLG, these are your three power levers:
Once these are humming, you can layer in monetisation metrics and virality.
* But remember: don’t benchmark blindly. PLG benchmarks are helpful, but context matters. A 30% activation rate might be excellent for one product and disastrous for another.
Instead:
Measure where you are now
Run experiments to move the needle
Look for trends and cohort improvements
Start With Your Biggest Risk
Startups are a sequence of hypotheses. At any given time, you’re trying to answer a question like:
“Do users actually want this?”
“Are users finding value quickly enough?”
“Will people pay for this?”
Pick metrics that answer your current existential question.
Examples:
If you’ve just launched → Focus on TTV, Activation Rate, and Key Feature Adoption Rate
If you have usage but no revenue → Add PQAs and Free/Trial-to-Paid Conversion
When Are You Ready to Lean Into PLG?
Here are a few signs you’re ready to double down on PLG as your go-to-market strategy:
✅ Your TTV is low, and most new users hit it in minutes or hours
✅ You’ve achieved consistent 30–40%+ activation rates
✅ Retention curves are flattening, not crashing
✅ You can reliably identify PQAs and close them efficiently
✅ You’re starting to see organic adoption (invites, referrals, sharing) without paid prompts
When you hit 3 or more of those? It’s time to shift from product validation to product-led distribution.
Remember: Learning Velocity Matters Most
As Ben W. shared in "12 Characteristics of High-Impact Product and Growth Teams", and I wrote in “Build, Measure, Learn: The Expanded Edition” the biggest predictor of growth isn't funding, team size, or even your product.
It's the speed at which your organisation can learn and apply those learnings.
These 9 metrics are learning tools that help you understand what's working, what isn't, and where to focus next.
Every metric you track should answer a question you’re actively working on. Start small. Make it a habit. Build dashboards that drive action.
The companies that win aren't necessarily the ones with the best initial product or the most resources. They're the ones that learn fastest and adapt most effectively to what they learn.
As you implement these metrics, remember that the goal isn't perfect measurement—it's creating feedback loops that accelerate your learning and adaptation.